IQ and Epilepsy Drugs

|


The New York Times has an article about how valproate, an anti-epilepsy drug, reduces the IQs of children with mothers who took the drug during pregnancy. 
Pregnant women who took a popular epilepsy drug, also widely used to treat migraines, pain and psychiatric disorders, had children whose I.Q. scores were significantly lower than those whose mothers took a different antiseizure medication, a new study has found.

[...]

Three-year-olds whose mothers had taken valproate during pregnancy had I.Q. scores that were nine points lower on average than children whose mothers had taken a different antiseizure medication, lamotrigine. The I.Q. scores of toddlers whose mothers took valproate were also lower than scores of children whose mothers took two other antiseizure medications, phenytoin and carbamazepine.

[...]


Cognitive assessments were conducted in 258 2- and 3-year-olds born to 252 mothers, of whom 53 had taken valproate.


Over all, children’s I.Q. scores were strongly related to mothers’ I.Q. scores, except among the children of mothers treated with valproate, the study found.


At age 3, children exposed to valproate in utero had a mean I.Q. of 92, compared with 101 for children exposed to lamotrigine, 99 for those exposed to phenytoin, and 98 for those exposed to carbamazepine, the study found.

A nine point reduction is a large effect -- three fifths of a standard deviation. Perhaps valproate could be used on mice to help unravel the neuro-anatomy of IQ. Dose some pregnant mice with valproate. Dose others with a placebo. Compare the cognitive function of the resulting offspring. If the offspring of the mice dosed with valproate display cognitive deficits (reduced ability to learn a maze, for example), then compare the brains of the experimental mice with the control mice to see what brian structure is missing or has been degraded. 


Economic Freedom

|


James Gwartney has been compiling a cross country list of economic freedom for around thirty years now -- enough data to come to some robust conclusions. Countries that are more economically free are more prosperous. The correlation is causative. Compare Argentina with Chile. Under Peron, Argentina went from a first world country to a third world country. Under Pinochet, Chile went from third world to first. Compare West Germany with East Germany, South Korea with North Korea, Hong Kong with China, America with Canada.  And so on and so forth. Time and again, history has thrown us the next best thing to controlled experiments. The conclusion is monotonous in its regularity. Freedom produces prosperity. 

Gwartney’s index includes five clusters of components: size of government, legal structure, free trade, sound money, and credit-labor-and- business regulation. In his presentation at Cato, Gwartney reports that legal structure -- respect for property rights and enforcement of contracts by independent courts -- is the component most strongly related to prosperity. 

Three cheers for the rule of law.

Genes and Politics

|

Poland's Kaczynski brothers. 

City Journal has an article by James Q. Wilson about DNA and political outlook. There is evidence that genes rather than experiences account for a sizable chunk of the differences in political outlook. 
Three political science professors—John Alford, Carolyn Funk, and John Hibbing—have studied political attitudes among a large number of twins in America and Australia. They measured the attitudes with something called the Wilson-Patterson Scale (I am not the Wilson after whom it was named), which asks whether a respondent agrees or disagrees with 28 words or phrases, such as “death penalty,” “school prayer,” “pacifism,” or “gay rights.” They then compared the similarity of the responses among identical twins with the similarity among fraternal twins. They found that, for all 28 taken together, the identical twins did indeed agree with each other more often than the fraternal ones did—and that genes accounted for about 40 percent of the difference between the two groups. On the other hand, the answers these people gave to the words “Democrat” or “Republican” had a very weak genetic basis. In politics, genes help us understand fundamental attitudes—that is, whether we are liberal or conservative—but do not explain what party we choose to join.
In addition, there is evidence that genes explain much of the reason why some vote and others don't.
Genes also influence how frequently we vote. Voting has always puzzled scholars: How is it rational to wait in line on a cold November afternoon when there is almost no chance that your ballot will make any difference? Apparently, people who vote often feel a strong sense of civic duty or like to express themselves. But who are these people? James Fowler, Laura Baker, and Christopher Dawes studied political participation in Los Angeles by comparing voting among identical and fraternal twins. Their conclusion: among registered voters, genetic factors explain about 60 percent of the difference between those who vote and those who do not.
Source: City Journal

Genetic Variation in Political Participation

|

American Political Science Review (2008), 102:233-248 Cambridge University Press
Copyright © American Political Science Association 2008
doi:10.1017/S0003055408080209

Research Article

Genetic Variation in Political Participation

JAMES H. FOWLERLAURA A. BAKER and CHRISTOPHER T. DAWES
a1 University of California, San Diego
a2 University of Southern California
a3 University of California, San Diego

Abstract

The decision to vote has puzzled scholars for decades. Theoretical models predict little or no variation in participation in large population elections and empirical models have typically accounted for only a relatively small portion of individual-level variance in turnout behavior. However, these models have not considered the hypothesis that part of the variation in voting behavior can be attributed to genetic effects. Matching public voter turnout records in Los Angeles to a twin registry, we study the heritability of political behavior in monozygotic and dizygotic twins. The results show that a significant proportion of the variation in voting turnout can be accounted for by genes. We also replicate these results with data from the National Longitudinal Study of Adolescent Health and show that they extend to a broad class of acts of political participation. These are the first findings to suggest that humans exhibit genetic variation in their tendency to participate in political activities.

Are Political Orientations Genetically Transmitted?

|

American Political Science Review (2005), 99:2:153-167 American Political Science Association
Copyright © 2005 by the American Political Science Association
doi:10.1017/S0003055405051579

ARTICLES

 
JOHN R. ALFORDCAROLYN L. FUNK and JOHN R. HIBBING 
a1 Rice University
a2 Virginia Commonwealth University
a3 University of Nebraska

Abstract

We test the possibility that political attitudes and behaviors are the result of both environmental and genetic factors. Employing standard methodological approaches in behavioral genetics—specifically, comparisons of the differential correlations of the attitudes of monozygotic twins and dizygotic twins—we analyze data drawn from a large sample of twins in the United States, supplemented with findings from twins in Australia. The results indicate that genetics plays an important role in shaping political attitudes and ideologies but a more modest role in forming party identification; as such, they call for finer distinctions in theorizing about the sources of political attitudes. We conclude by urging political scientists to incorporate genetic influences, specifically interactions between genetic heritability and social environment, into models of political attitude formation.

AP Econ Quiz

|


The New York Times has a quiz with questions drawn from past AP Economics tests.


Most of the “correct” answers presuppose a Keynesian framework. 

Genes or Experience: Experienced Opinion

|


People with more experience are more likely to believe that genes are more important than experiences in determining personality.

Genes or Experience: Popular and Educated Opinion

|


1-in-4 Americans believe that it is genes rather than experiences that are the biggest determiner of personality.

Does that change with years of schooling? Not as much as I expected.

We can safely ignore the results of the respondents who had less than 8 years of schooling. The sample sizes are too small. (There were only 12 respondents in the "7 years of schooling" camp. The other, shorter lengths of schooling had even fewer). Above that, the ratio largely moves in a range from 1-in-5 to a little over 1-in-4. The outliers can be found at the ends of the range of education. People with only high school education are more likely to believe in genes. People with post-graduate education, less so. People with 19 years were the least likely to believe in the power of genes. Tenured radicals. Retirement looms.

Source: GSS

Two, Three, Many Neandethal Groups!

|


ScienceDaily (Apr. 15, 2009) — The Neanderthals inhabited a vast geographical area extending from Europe to western Asia and the Middle East 30,000 to 100,000 years ago. Now, a group of researchers are questioning whether or not the Neanderthals constituted a homogenous group or separate sub-groups (between which slight differences could be observed).
.
Paleoanthropological studies based on morphological skeletal evidence have offered some support for the existence of three different sub-groups: one in Western Europe, one in southern Europe and another in the Levant.

Researchers Virginie Fabre, Silvana Condemi and Anna Degioanni from the CNRS Laboratory of Anthropology (UMR 6578) at the University of Marseille, France, have given further consideration to the question of diversity of Neanderthals by studying the genetic structure of the mitochondrial DNA (mtDNA) and by analyzing the genetic variability, modeling different scenarios. The study was possible thanks to the publication, since 1997, of 15 mitochondrial DNA (mtDNA) sequences (the mtDNa is maternally transmitted) that originated from 12 Neanderthals.

The new study confirms the presence of three separate sub-groups and suggests the existence of a fourth group in western Asia. According to the authors, the size of the Neanderthal population was not constant over time and a certain amount of migration occurred among the sub-groups. The variability among the Neanderthal population is interpreted to be an indirect consequence of the particular climatic conditions on their territorial extension during the entire middle Pleistocene time period.

Family: East and West

|

Table One
Table Two
We have all heard that that Chinese culture is Confucian culture, and Confucian culture is filial, whereas Western culture, in contrast, is individual. Right?

Not so fast.

The World Values Survey asked respondents in China, Taiwan, Singapore, and America to rate the importance of family on a five point scale from “Very Important” to “Not Important at All”. I used the data sets from these countries from the latter part of the 90’s and/or the early part of the New Century. (Click Table One to enlarge)
.
Guess what? Nearly everone in America thinks that family is “Very Important” -- 95%. Although “Very Important” is also the most popular answer in China, the level is only 70%.
.
Why is this?
.
One interesting pattern that stands out is Singapore, which is predominately Chinese but part of the Anglosphere. Filial concern there is at American levels (i.e., very, very high). In fact, if you look at a wide variety of Anglosphere counties -- Australia, Britain, Canada, New Zealand -- the levels are all above 90%. (Click Table Two to enlarge).
.
Anglosphere beliefs are more profilial than Sinosphere ones (except where the two overlap).

Library Beautiful

|

Wren Library, Trinity College, Cambridge, England

Land Reform in China

|

Most people in China live in rural areas. Although more and more people are moving to the cities, only 40% live in urban areas. As the countryside goes, so goes the nation. And the countryside is trailing. While both have grown, the growth in wealth over the last 30 years has been faster in the cities than in the countryside. Country folk now earn less than a third of their urban counterparts.

In China, land legislation is Georgist. The State claims to own the land. Framers lease the land from the State under 30 year contracts. Since these leases can be sold, they are worth something, and can, in theory, be used to secure a loan. But there is a problem. Farmers are reluctant to make investments in their land when the land can be seized by the local cadre and redistributed in the interest of equality, a process called “readjustment“. Prosterman estimates that there is about $3 trillion worth of “dead capital” in rural China -- land that is not benefiting from the use of capital improvements such as electric pumps and greenhouses, which could make the land more productive and farmers wealthier.

At the outset of his presentation, Prosterman gives a thumbnail sketch of land reform in China. Few people remember that from 1949 to 1956, before collectivization and the Great Leap Famine, the Party made good on their promise to recognize and enforce the full private ownership of peasant farmers. Perhaps it is time for the Party to return to its roots.

Europe’s Best Kept Secret: Portuguese Drug Decriminalization.

|


In late 2001, Portugal decriminalized the possession of all drugs; not just cannabis, but also other street drugs such as heroin, cocaine, LSD and so on and so forth. That was then, this is now. What has happened since? The important point to take away from Glen Greenwald’s recent talk at CATO is what didn’t happen. Predictions of dire consequence did not play out. Opposition to the decriminalization among the various major political factions in Portugal is now virtually non-existent. In fact, the results have been so boring that few outside the country even know of Portugal’s experiment.

An other issue raised (yet not fully developed) in the talk is the extent to which international law (treaty obligations, in this case) obstructs efforts at more localized drug law reform.

Portugal is the dog that didn’t bark. Perhaps our keepers in Washington should take note.

Who Has Contributed More?

|

UNESCO keeps a list of World Heritage Sites. The list provides us with a way to determine which populations have contributed more to Civilization while side stepping the accusation of Euro-centric bias. (If the UN is not a sorce for World Opinion™, nothing is.)


Observe that the distribution of natural sites is more evenly distributed among the regions than the cultural ones are. This provides us with a rough baseline for comparing populations and their cultural contributions. People don’t create natural sites. Nature does. The people who live there can not claim credit for having created them. Cultural sites, on the other hand, are man made. People can claim credit.

The regional ranking of world cultural sites is as follows:

Euro-America > Asia-Pacific > Caribo-America > Arabia > Africa.

The West beats the East. The Old World beats the New. Everyone beats Africa.

Why More Girls Than Boys Are Entering College.

|


More girls than boys are going to college. Conservatives commentators claim this is due to the feminization of education. Guys either opt out because schools are hostile to them, and/or girls are at an advantage because schools speak their language. But which is cause and which is effect? Are there fewer males because schools are more feminized, or are schools more feminized because there are fewer males? More likely, it’s largely a combination of two other factors: the greater variation of intelligence among males than among females, and falling entry requirements.


Assume two normal distributions, two bell shaped curves: blue and green. They both have the same average. One has more variation than the other. At the tails, there are more blues than greens. In the middle, there are more greens than blues. If you bisect the overlapping bell shaped curves at some point above the averages there will be more blues than greens. If you bisect the curves at some point below the averages, there will be more greens than blues.


Think of the different methods of bisecting the distributions as falling entry requirements. Think of the wide-and-low blue distribution as boys, and the narrow-and-tall green distribution as girls. More and more people are entering college. Entry requirements are falling. We have moved from an era when more boys were qualified to an era when more girls are qualified.

Go East, Young Man.

|


There are 1.3 billion people in China, 0.3 billion in America. Somehow this led me to assume there are more students of higher education in China than America. Not so. America has more. (At least they did as of 2002.) This is not likely to remain. Enrollment levels have been rising rapidly in China, slowly in America. (Levels actually fell slightly in the late 90s). China will overtake America in number of students at institutions of higher learning, if they haven’t already.


Enrollment levels in China since 1980

Enrollment levels in American since 1980


Source: Nationmaster

Library Beautiful

|

Suzzallo Library, Seattle, Washington, USA

English Country House

|


A Cartoon History of the Financial Crisis

|

Flowing Data is a great site for those of us who can never get enough of the visual display of quantitative information. Here is a video that vividly displays nuts and bolts of the financial crisis.


The Crisis of Credit Visualized from Jonathan Jarvis on Vimeo.

Health Care Redux

|


Most Americans believe that the nation’s health care system is in need of substantial changes. But there is less support for completely rebuilding the health care system than there was in April 1993, during the early stage of the Clinton administration’s unsuccessful effort to revamp health care.
Health care reform failed in 1993. Support for reform is lower now than then.With an eye to the current round of health care reform, I’ll let you finish the syllogism.

Source: Pew

Noam Chomsky: A Rebuttal

|

In addition to the monies gleaned from the American War Machine as a professor at MIT, gadfly and self described "parasite" Noam Chomsky has made a tidy sum for himself from a lifetime of assailing Uncle Sam for being one of the largest, if not the greatest, sources of terror in the world today. If we should subscribe to this way of thinking, then the history of the 20th Century would make little sense. Take the regions of the world in the last half of the 20th Century, rank them according to the extent of Uncle Sam’s intervention, by either foreign direct investment or arms and soldiers. Europe would be on top, Africa would be on bottom. Whether you measure the results by GDP per capita or the UN’s Human Development Index, conditions are worst where America has intervened the least, best where Uncle Sam has intervened the most.

The More Things Change, The More They Stay The Same. (With Some Exceptions)

|

Wealth in ~1500
Wealth in ~1900

Wealth in ~1960
Wealth in ~1990
Wealth in ~2000
Wealth in ~2015

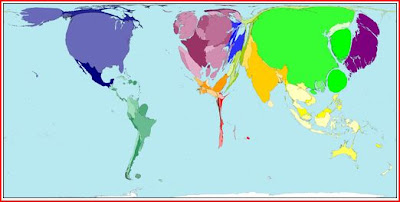
Here is a series of maps that display the distribution of wealth by country over time. The sizes of the countries on the maps have been adjusted to reflect the percent of world wealth. Thus France is larger than Brazil on the maps, even though, geographically, Brazil is larger.

We can see that Europe has had a good run for the last 500 years. China and India, less so. I don’t trust the numbers for the New World circa 1500. Charles Mann has made the case that the field of pre-Columbian studies has changed dramatically in the last quarter century. I don’t think the reference books in the field of economic history have had a chance to catch up.
.
Projecting forward to 2015, it looks like the distribution of wealth in the Old World will look more and more like it did back in 1500. The more things change, the more they stay the same. India and Africa are expected to underperform compared to their relative performance 500 years ago. Room for improvement? Cause for optimism?
.
Worldmapper includes this little statistical gem with its map of wealth in 1900:
In 1900 the world[’s] total [wealth] was US$2 trillion when expressed in 1990 purchasing power parity.
2 trillion dollars! The bailout alone will cost more than that this year, not to mention the price tag on the new and ambitious social programs that Uncle Sam has in store for us. One thing we can say is that the world is a lot wealthier now than it was 100 years ago -- a lot. The relative distribution of wealth reflected in the series of maps overlooks the growth in absolute terms. There is a lot more wealth around that can be safely wasted.
.
Or can it?
.
Source: Worldmapper

Rock of Ages

|

Wikipedia has a list of verified oldest people.

Among the top 100 verified oldest people:

- Half the population of the world is women, but there are more women than men on the list of verified oldest at a rate of 9 to 1.

- 1 in 20 people on Earth is American, but most on the list of verified oldest come from America.

- About 1 in 8 Americans is black, but among the top 10 verified oldest Americans, four are black.

- About 1 in 3 Americans live in the South, but among the top 10 verified oldest Americans, more than half are from the South.

Note to self: work harder at being a southern, black, American female.

Source: Wikipedia

Borat's Great Grandmother?

|


In August of 1997, Jeanne Calment of France died at the age of 122 -- the oldest verified person on record. Mdme. Calment may have a challenger in one Sohan Dosova of Kazakhstan.

Meet Sohan Dosova - the newly found treasure of Kazakhstan. She is 130 years old, at least she is according to her documents. The Soviet passport issued in the early 1980s states that Sohan Dosova was born in the Karaganda region on 27 March 1879.

Wikipedia has a list of verified oldest people.

130 is considerably older than any other contender for the award of Oldest Person. Excluding Sohan Dosova, the top five ages are 122, 120[?], 119, 117, and 117. Notice that the other contenders for Oldest Person are all within two years of the next person on the list. There is a whopping 8 year gap between Dosova and Clement. Likely there was some exaggeration in Dosova’s age. We don’t have her birth certificate, only a passport that dates from the early 1980s. That’s about 25 years ago. If she claims to be 130 now, she would have been claiming an age over 100 then -- something that would have been a feather in her hat even at that time. Even so, she might be a real contender.

If she really is 130, shouldn’t she have great-great-grandchildren, or even great-great-great-grandchildren by now? Assuming generations of 25 years, there should be five generations of Dosovas. The article says her oldest granddaughter is 53. If Sohan had a child at 20 and that child had a daughter at the age of 25, that would make Sohan 98, not 130. A better estimate of her age could be reconstructed by looking at her family tree and working backwards from known and recorded birth dates.

Is there a way to verify a living person’s age directly? Telomeres shorten with each cell division. And the article says she still has one tooth left.

Source: BBC

"Distortionary and Dangerous"

|


"If you remember only one thing I say -- this is actually the most important thing to remember -- enlarging a budget deficit is an especially distortionary and dangerous form of taxation."

Why? Because you can’t escape the laws of arithmetic. Because public borrowing is deferred taxation (with interest), and the Devil of Taxation that you know here and now is not as bad as the Devil of Taxation that you don’t know at some point in the uncertain future.

The relevant commentary begins at 9:47

What's the Matter with Kansas?

|


The New York Times has a multimedia map of unemployment rates by county. Organized this way, it is easy to see how hard the downturn has hit the West Coast. In contrast, the Flyover States are sitting pretty. “What’s the matter with Kansas?” Full employment, that’s what.

Source: New York Times

Eternal Sunshine of the Spotless Mind

|


(Click images to enlarge)

Interiors

|

Real estate listings can be a great source of ideas for interior design and decoration.


Polished marble floors, rococo wall sconces, crown moulding.

Raised panel wainscoting, pilaster columns, entablature.
.
Now that’s the way to fill the vertiginous space created by one of those vaulted ceilings that were ever so common among 80s vintage houses.

Note the use of light and lighting.


When, exactly, did marble counter tops become mandatory? At least we can say that one legacy of the Great Housing Bubble will be an abundance of fabulous kitchens. Every cloud has its marble lining. How much you want to bet that the appliances are brushed steel?

Heads, I Win. Tails, the Taxpayer Loses.

|

Joe Stiglitz disects the Geither Plan and finds it lacking.

The government plan in effect involves insuring almost all losses. Since the private investors are spared most losses, then they primarily “value” their potential gains. This is exactly the same as being given an option.

Consider an asset that has a 50-50 chance of being worth either zero or $200 in a year’s time. The average “value” of the asset is $100. Ignoring interest, this is what the asset would sell for in a competitive market. It is what the asset is “worth.” Under the plan by Treasury Secretary Timothy Geithner, the government would provide about 92 percent of the money to buy the asset but would stand to receive only 50 percent of any gains, and would absorb almost all of the losses. Some partnership!

Assume that one of the public-private partnerships the Treasury has promised to create is willing to pay $150 for the asset. That’s 50 percent more than its true value, and the bank is more than happy to sell. So the private partner puts up $12, and the government supplies the rest — $12 in “equity” plus $126 in the form of a guaranteed loan.

If, in a year’s time, it turns out that the true value of the asset is zero, the private partner loses the $12, and the government loses $138. If the true value is $200, the government and the private partner split the $74 that’s left over after paying back the $126 loan. In that rosy scenario, the private partner more than triples his $12 investment. But the taxpayer, having risked $138, gains a mere $37.

Even in an imperfect market, one shouldn’t confuse the value of an asset with the value of the upside option on that asset.

Stiglitz concisely diagnoses the problem:
The main problem is not a lack of liquidity. If it were, then a far simpler program would work: just provide the funds without loan guarantees. The real issue is that the banks made bad loans in a bubble and were highly leveraged. They have lost their capital, and this capital has to be replaced.

In a recent podcast of EconTalk, Allan Melzer suggested an alternate approach. Have the banks raise the money they need on the open market while Uncle Sam pledges to match the money raised dollar-for-dollar. If a bank can not raise the money they need, they are insolvent, need to be shut down, and sold off. This way, the taxpayer would only be on the hook if a bank has at least one foot on the ground.

The dead wood needs to be cleared out of the system, not piled on the backs of the taxpayer for years to come.

Getting a Lag Up?

|

(Click image to enlarge)

Calculated Risk has a graph that shows the history of unemployment rates for the last fifty years or so.

Sure enough, unemployment is a lagging indicator: the rate never falls until a recovery is underway. The pattern that surprises, however, is how quickly the rates fell in the 60s, 70s, and 80s after the economy turned the corner into recovery. It’s only in the last 20 years (two recessions) that lag has been so long. What changed in the economy around 20 years ago that would account for this growth in the time lag?

Trillions

|

Uncle Sam has put the taxpayer on the hook for an amount nearly as large as the economy itself in just under six months.

The U.S. government and the Federal Reserve have spent, lent or committed $12.8 trillion, an amount that approaches the value of everything produced in the country last year, to stem the longest recession since the 1930s. New pledges from the Fed, the Treasury Department and the Federal Deposit Insurance Corp. include $1 trillion for the Public-Private Investment Program, designed to help investors buy distressed loans and other assets from U.S. banks. The money works out to $42,105 for every man, woman and child in the U.S. and 14 times the $899.8 billion of currency in circulation. The nation’s gross domestic product was $14.2 trillion in 2008.

Source: Bloomberg

Am I wrong to feel uneasy about this? If America were a firm with shares trading on a stock exchange, I would have to take a pass. Too risky.

The Wall

|

Queendom.com has an real life honest-to-Jupiter IQ test.


Unfortunately the full report is behind a subscription wall.

Grr.


©2009 The Engram | Template Blue by TNB